The motivation
The Pomodoro technique assumes everyone focuses on the same schedule. 25 minutes on, 5 minutes off, fixed, regardless of whether you're in flow or already checked out. It never really worked for me consistently and so I wanted to explore that.
The experiment
Before building anything, we had to figure out what to actually measure. Eye movements artifact EEG badly, so a reading task was out. A listening task avoided that but couldn't capture visual attention.
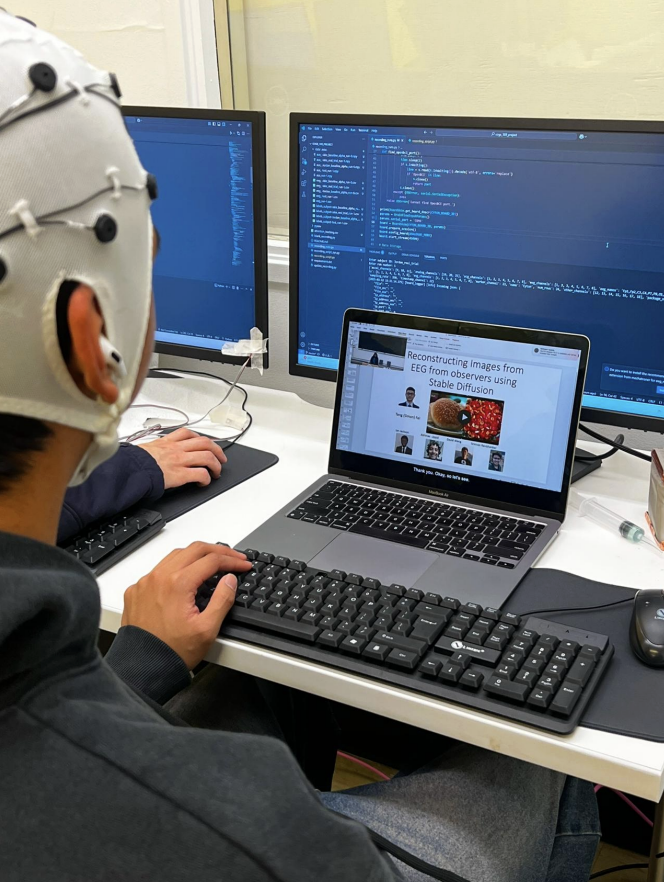
We landed on watching a lecture on a small screen. Participants watched for 10 minutes, took a 5-minute break, then another 10, while we recorded from 7 frontal channels using OpenBCI.
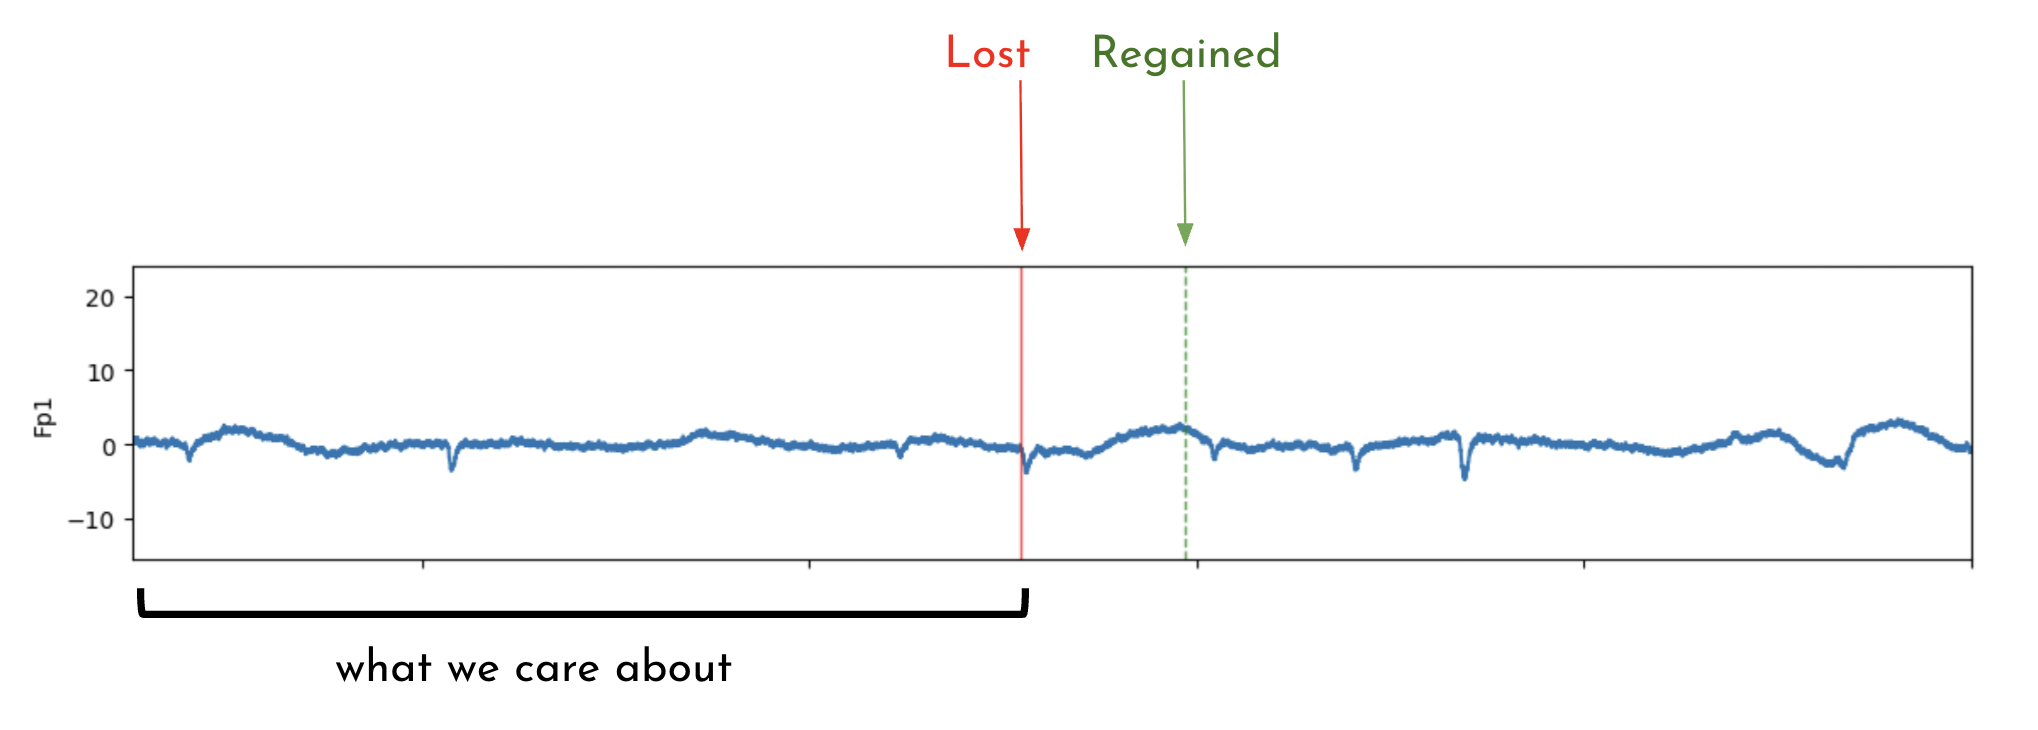
They pressed keyboard buttons in real time to self-report when they lost focus and when they regained it.
Channels used
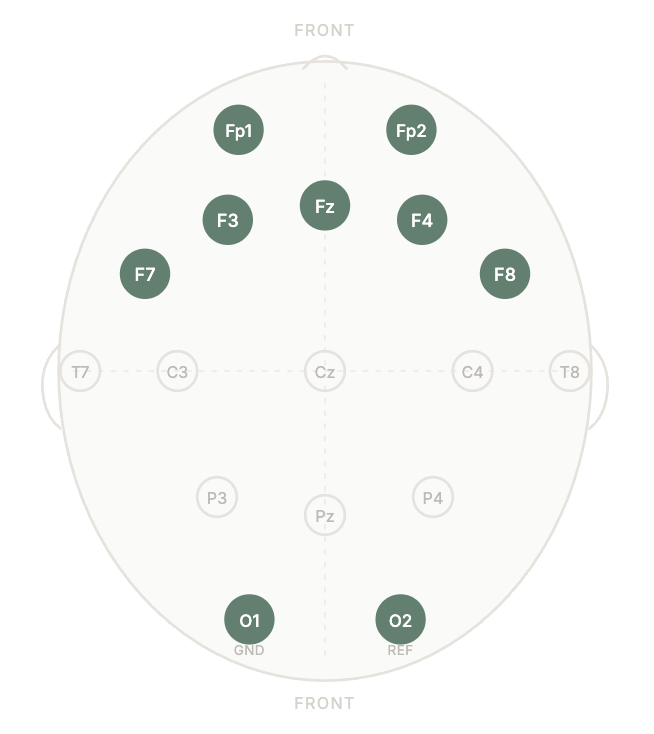
All 7 channels sit in the frontal region. Fp1 and Fp2 cover the prefrontal cortex, most directly tied to attention and cognitive control. F3 and F4 capture working memory and focus, positioned symmetrically to pick up hemispheric differences. F7 and F8 track frontal asymmetry. Fz anchors the midline. Ground at O1, reference at O2.
What I built
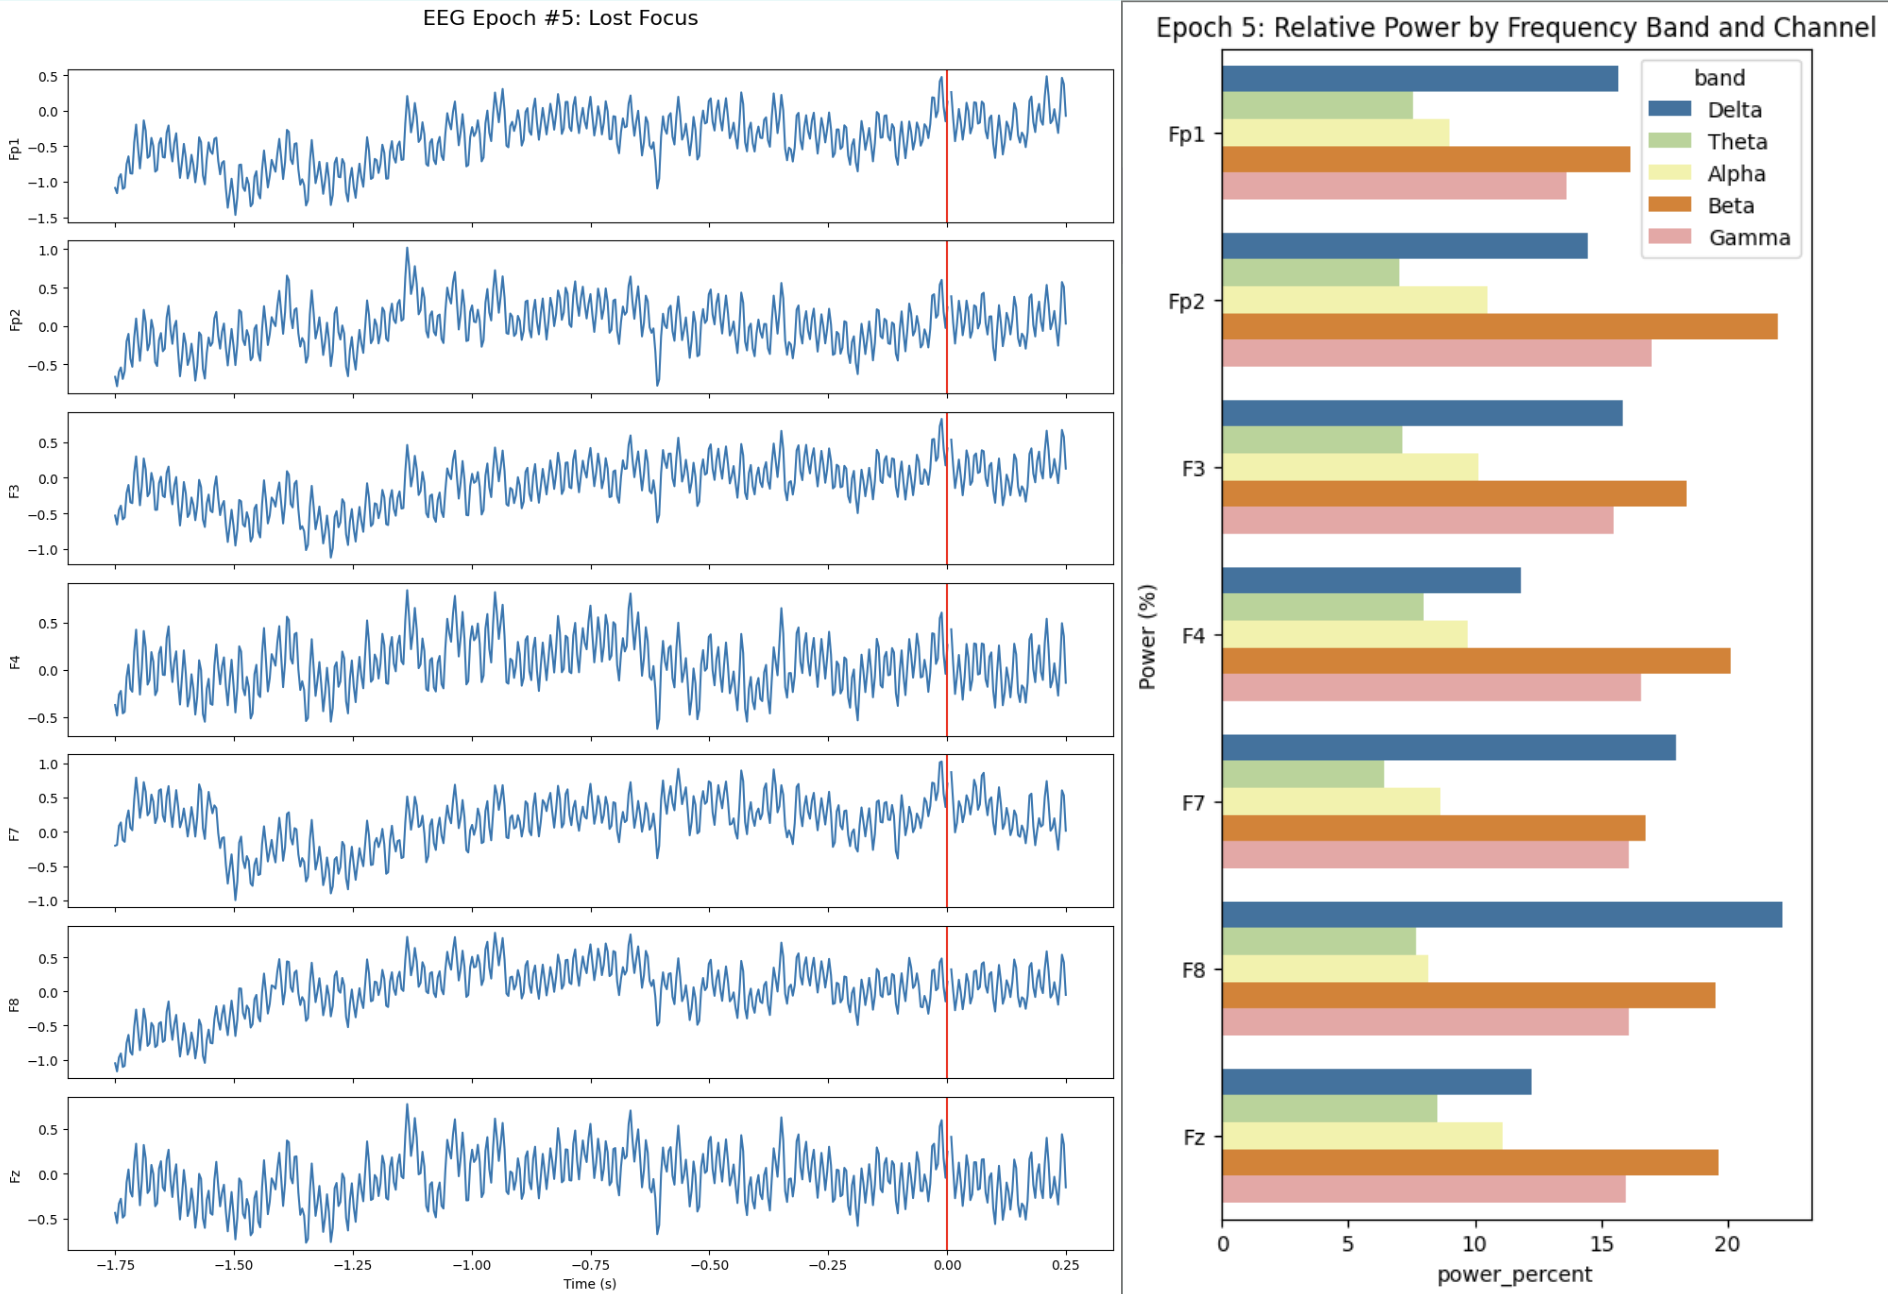
The pipeline filtered the raw EEG between 0.1 and 50 Hz, then epoched the data into 2-second windows aligned to the self-report markers. From each epoch I extracted relative band power across Delta, Theta, Alpha, Beta, and Gamma for all 7 channels. Alpha suppression and Beta elevation in frontal regions are established markers of active attention. Theta increases tend to signal cognitive load or fatigue.
What I found
There were visible differences in band power between focused and unfocused epochs, particularly in Alpha and Beta at the prefrontal channels. But the labels were imprecise and the windows short. Self-reporting while trying to focus is its own problem. It worked as a proof of concept, which is the honest place a single-session small-N EEG study lands.